Region
The information and analyses presented in this article are based on data from FinScope consumer surveys conducted in South Africa between 2003 and 2023. The FinScope 2024 results will be released on May 20, 2025, as a lead-up event to the Responsible Finance Forum (RFF) 2025, hosted by the Center for Financial Inclusion at Accion, in Johannesburg between May 20–22.
The FinScope methodology, which has been successfully implemented in 38 countries in Africa, Asia, and the Caribbean, is considered the benchmark and gold standard for demand-side research in financial inclusion. It was the first globally recognized demand-side data source to measure financial inclusion indicators at a national and regional level. The survey is implemented annually in South Africa using a syndication model with members including policymakers, regulators, and financial service providers.
Ahead of the launch of the FinScope South Africa Consumer Survey 2024 at the upcoming Responsible Finance Forum 2025 event in Johannesburg, this article provides a historical perspective on the survey’s first 20 years. The 2024 survey marks 30 years since South Africa’s first democratic elections in April 1994, highlighting a significant milestone for the country’s ongoing economic transformation.
Since its launch in 2003, the FinScope survey has revolutionized our understanding of financial inclusion. In preparation for the release of the FinScope South Africa Consumer Survey 2024, we reflect on insights gathered during the first two decades (2003–2023) to celebrate progress, identify persistent challenges, and highlight future opportunities.
FinScope Revolutionized Financial Inclusion Measurement
Before the first FinScope South Africa Consumer Survey in 2003, financial inclusion measurement relied on supply-side information — counting bank accounts and access points relative to the population. This approach provided limited insight into people’s actual financial lives and behaviors.
FinScope South Africa pioneered demand-side measurement as the first nationally representative financial inclusion-focused survey — a methodology now considered the global standard for financial inclusion research.
FinScope South Africa pioneered demand-side measurement as the first nationally representative financial inclusion-focused survey, prioritizing understanding consumer needs, behaviors, and challenges through direct data collection — a methodology now considered the global standard for financial inclusion research.
Nearly Universal Formal Financial Access Alongside Democratic Transition
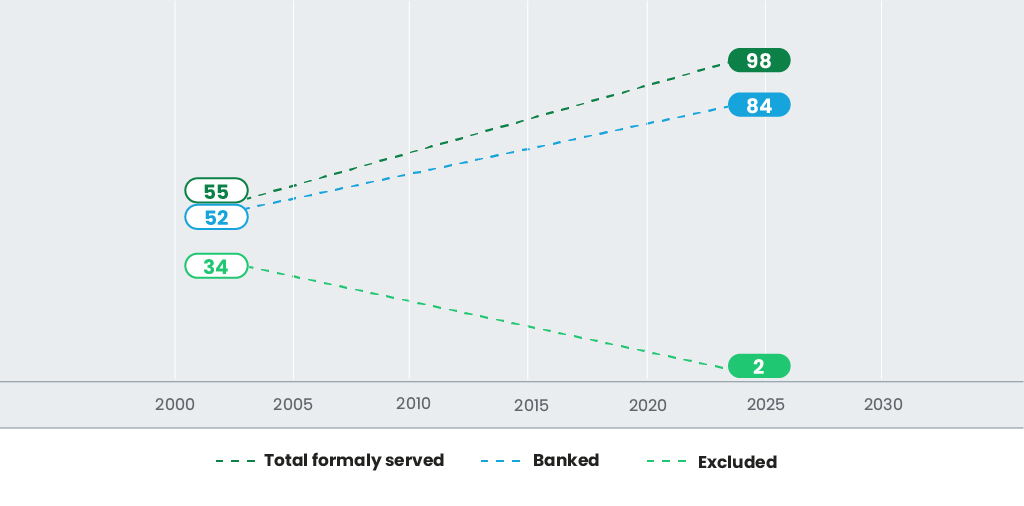
When using formal financial system access as a measure, South Africa’s financial inclusion journey shows remarkable success. In 2023, 98 percent of adults were served by the formal financial sector, with 84 percent having a bank account in their own name — significant progress from 2003, when just 52 percent of adults were banked and 55 percent served by formal institutions.
Figure 1: Overall Adult South African Financial Access (%) 2003 Compared to 2023
This financial transformation is even more impressive in the context of South Africa’s broader societal changes. When the first FinScope survey launched, South Africa’s democracy was less than a decade old, having held its first democratic elections in 1994. Prior to democracy, the country’s Black majority population (nearly 80 percent) had faced severe economic and political marginalization under apartheid, classified as citizens of separate “homelands” rather than South Africa itself.
The banking sector in 1994 perceived few South Africans as viable clients. A financial industry built around net interest margins and fees saw limited commercial opportunity in serving a largely low-income and unemployed population.
Cross-Sector Collaboration Drove Financial Inclusion Forward
The year 2003 marked both FinScope’s launch and another pivotal development in South Africa’s financial inclusion journey — the Financial Sector Charter (FSC). This voluntary agreement brought together private sector institutions, civil society organizations, and government to address historic marginalization and drive transformation.
A key FSC target was providing bank accounts to 80 percent of the low-income population. In 2003, only 30 percent of lower-income South Africans (those in Living Standards Measure categories 1–5) had bank accounts.
To address this gap, South Africa’s banks collaborated to launch the Mzansi account in 2004. This entry-level banking solution required only an identity card, featured zero monthly fees, included a debit card, and standardized withdrawal fees across all ATMs, regardless of the issuing bank. By 2009, over six million Mzansi accounts had been opened — a significant achievement in a country with approximately 32 million adults at the time.
While the Mzansi initiative provided important momentum, the broader expansion of formal financial inclusion from 55 percent to 98 percent of adults between 2003 and 2023 involved additional factors. The Mzansi account carried a stigma of poverty for many users, and newer banks with compelling low-cost offerings gained significant market share, pushing established institutions to compete with rebranded products.
Social Security Payments Boosted Access to Formal Accounts
The most significant driver of formal account adoption has been the government’s strategic decision to distribute monthly social security payments through the banking system.
Toward the end of apartheid, monthly old age pension payments to Black South Africans were increased and ultimately equalized across all racial groups by late 1993. In 1994, about 8 percent of adults received a pension.
In 1998, the government introduced the means-tested monthly child support grant for low-income households with children. Initially targeting the youngest children, this program expanded steadily until 2010, when it covered all qualifying households with children up to age 18.
In 2020, responding to COVID-19 lockdown impacts, the government introduced the monthly Social Relief of Distress (SRD) grant, which reaches more than 15 percent of adults.
Social security coverage grew from 8 percent of adults in 1994 to 13 percent in 2003. By 2023, 46 percent of adults received some form of monthly social grant — making South Africa’s social security system one of the world’s largest in both absolute terms and population coverage.
Initially, social grant payments combined monthly cash disbursements with bank account deposits through four payment providers. The cost of this cash-heavy approach prompted the South African Social Security Agency (SASSA) to consolidate grant payments in 2012, appointing a single provider and realizing significant savings.
This provider built a solution that onboarded almost all grant recipients to a digital system, issued SASSA debit cards, and increasingly shifted monthly payments from in-person cash disbursement to account-based transfers.
When the SRD grant launched in 2020, both the government and population were prepared for a remote digital system that could handle enrollment and monthly payments.
South Africa’s Income and Employment Trends Present Challenges
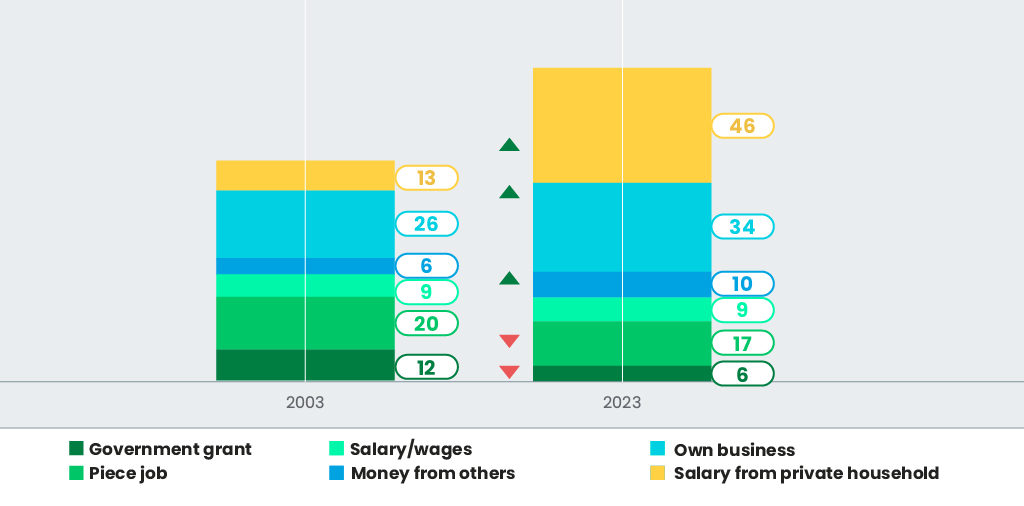
While social security expansion has provided a crucial safety net, labor market trends since 2003 raise concerns. Over the past two decades, only 9 percent of adults earn an income through businesses, highlighting the need to support informal entrepreneurship. The percentage of formal salary earners has declined, and more adults are relying on government grants or family support.
In 2023, 68 percent of adults received assistance from either the state or their social networks, up from 37 percent in 2003. Many now receive support from both sources, reflecting deeper social needs and structural economic changes.
These shifts have critical implications for financial service design and policy development aimed at enhancing consumer resilience.
Figure 2: Shifts in Income Source Breakdown for Adult South Africans (%) in 2023 Compared to 2003
Digital Financial Access is High, but Usage Remains Shallow
Although mobile internet infrastructure has transformed digital access possibilities, transactional usage of digital financial services remains limited.
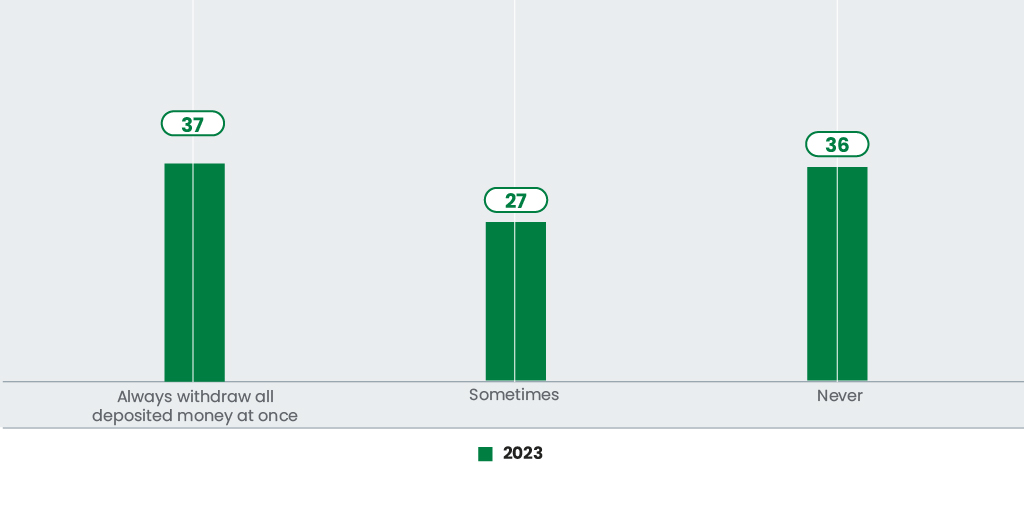
While government grants are commonly disbursed through digital channels, this has not translated to active digital financial behavior among recipients. Many withdraw their entire benefit immediately and rely primarily on cash for daily transactions, limiting the broader potential of digital financial inclusion.
In 2023, 76 percent of grant recipients withdrew their full benefit amount upon receipt, reflecting a “mailbox banking” behavior observed among 14 million adults. Moreover, 71 percent of adults primarily use cash for food and grocery purchases. These patterns indicate that cash remains central to household financial management.
Figure 3: Incidence of Bank Users Withdrawing All Money from a Bank Account (%) in 2023
Formal Access is High, but Key Financial Areas Remain Underused
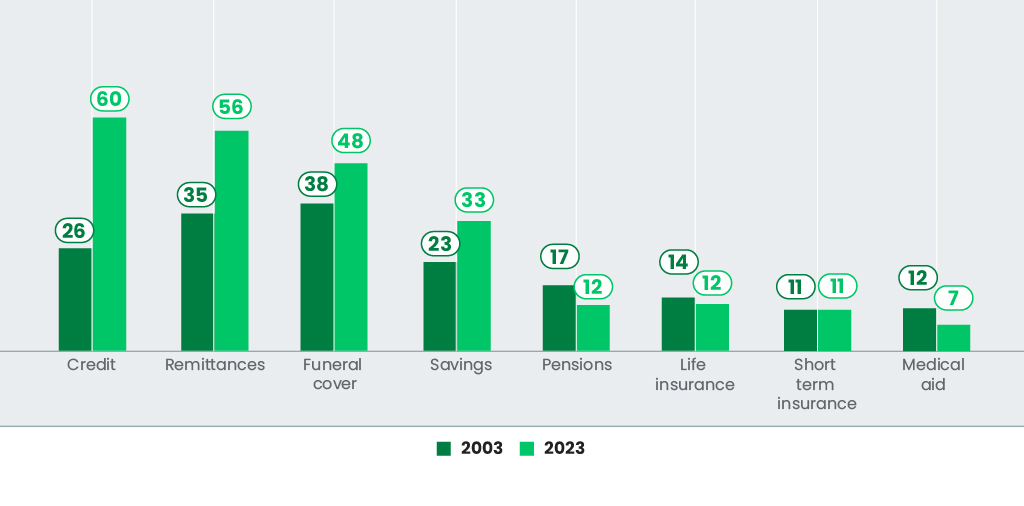
Beyond overall formal financial access, significant increases have occurred in formal credit and remittance services, yet other dimensions of financial inclusion show less progress.
Funeral insurance, culturally important in South Africa, has seen strong formal sector adoption. However, other essential products that support long-term resilience — including pension savings, life insurance, and medical cover — show much lower uptake rates.
Figure 4: South African Adult Formal Financial Category Uptake (%) in 2023 Compared to 2003
Mismatch Between Financial Needs and Available Services
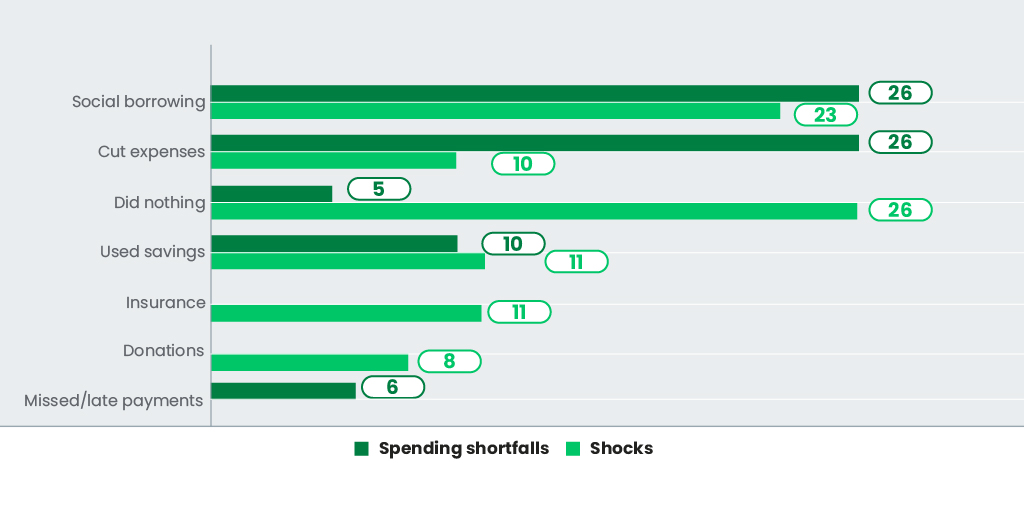
When facing financial shortfalls, most South Africans turn to social networks or simply endure without assistance. Only a minority use formal financial services to manage these financial shocks. Borrowing and saving typically focus on short-term consumption needs rather than long-term goals like housing or business investment.
Figure 5: Main Financial Strategy to Cope with Spending Shortfalls and Shocks (%) in 2023
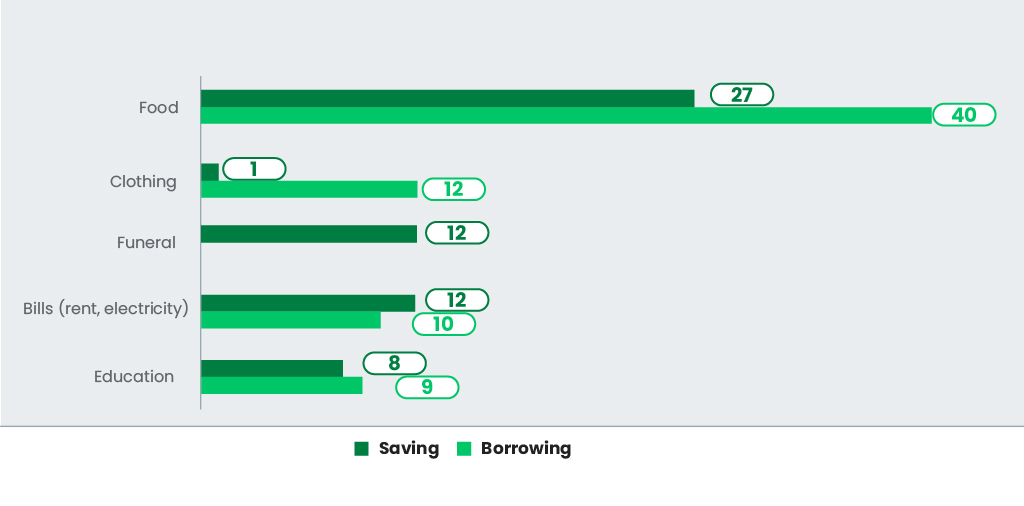
In 2023, consumption formed the largest spending category for 84 percent of adults. It also dominated reasons for saving and borrowing, with 40 percent of borrowers primarily taking loans for food.
Figure 6: Main Reasons for Saving and Borrowing (%) in 2023
This situation reveals a fundamental challenge: The formal financial sector is not aligned with how most consumers earn, spend, and manage money. Standard financial products often fail to reflect the realities of informal employment, irregular income patterns, and cash-dominant lifestyles.
Implications for Global Financial Inclusion Strategies
South Africa’s experience offers important lessons for other economies. In a world of growing economic uncertainty and changing work patterns, more consumers globally will likely shift toward informal or precarious employment. This trend will challenge conventional financial inclusion models, including those offered by fintech providers.
To achieve meaningful outcomes for consumers, financial services must address the lived realities of low-income and vulnerable populations by:
- Offering savings and risk protection products that are affordable and flexible;
- Designing for cash preference and offline environments;
- Supporting small-scale investment opportunities; and
- Building trust and reducing costs.
These solutions must be simple, locally relevant, and easy to use, especially in underserved areas.
The Path Forward: Reorienting the Financial Sector
Financial inclusion must go beyond access. To drive meaningful impact, financial systems must adapt to structural shifts in employment, income, and consumer behavior. This requires policy, regulatory, and supply-side adjustments to meet consumers where they are.
To drive meaningful impact, financial systems must adapt to structural shifts in employment, income, and consumer behavior.
FinMark Trust has developed key partnerships and programs, such as community digitization and Generating Better Livelihoods through Linkages (GBL), to catalyze more sustainable change.
South Africa demonstrates that headline financial inclusion figures can mask serious gaps in usage and impact. The next phase of inclusive finance must focus not only on expanding access but also on aligning services with how people actually live and work.
For more information, please contact:
Bobby Berkowitz (Bobbyb@finmark.org.za)
Dr. Kingstone Mutsonziwa (Kingstonem@finmark.org.za)
Authors


Explore More