
Topics
Over the last few years, the pandemic-induced transformation of the global economy has fueled a rapid expansion of the fintech sector. This evolution has revealed the potential of fintech to eliminate geographical and physical barriers and enable consumers and providers to gain unprecedented access to information, creating a more efficient, inclusive global financial system.
Nonetheless, the fintech expansion in low- and middle-income markets faces numerous challenges, and several unanswered questions linger. Will the fintech sector maintain its momentum? How will it evolve in a post-pandemic world? What unforeseen challenges await? These queries spotlight the intriguing unknowns within the sector.
While inclusive fintechs have expressed their commitment to continue serving low-income and vulnerable segments, their ability to sustain that commitment depends on funding.
Earlier this year, we interviewed 12 winners of the Inclusive Fintech 50 (IF50) competition and six fintech investors to assess their performance amidst numerous macroeconomic challenges like rising interest rates, decreased food supply, and large price gains. In June 2023, we published the findings of these conversations in a recent report, Inclusive Fintech Funding in Times of Uncertainty, which underscored the commitment of inclusive fintechs to serve low-income individuals. To ensure success, these companies are bolstering their emphasis on core business principles, prioritizing customer needs, and actively working toward substantial revenues and profits.
While inclusive fintechs have expressed their commitment to continue serving low-income and vulnerable segments, their ability to sustain that commitment depends on funding. To better understand the fintech funding landscape, we analyzed funding data provided by Briter Bridges from different periods, regions, and market segments. Nearly 75 percent of the fintechs in this dataset have raised capital up to Series B deals. Our analysis focused on four regions: Latin America & the Caribbean, the Middle East & North Africa, Sub-Saharan Africa, and South Asia. From South Asia, Briter Bridges only collected data for India. From the Briter Bridges data, we examined funding deals from January 2015 to February 2023 and identified four key trends in fintech funding.
1. Fintech funding is slowing down globally.
Since 2015, fintech funding has consistently trended upward – both in terms of the number of deals and total deal volume – with a minor slowdown in 2020 during the COVID-19 pandemic and a significant surge in 2021. Notably, the number of overall deals increased from 484 in 2020 to 851 in 2021, while the total deal volume rose by 96 percent – from USD $5.3 billion in 2020 to $10.4 billion in 2021.
Among the regions, South Asia (representing data only from India) experienced the highest increase in total deal volume since 2015, followed by Latin America & the Caribbean, the Middle East & North Africa, and Sub-Saharan Africa. The surge across all regions indicates a promising industry landscape and highlights investors’ interest in fintech across geographies.
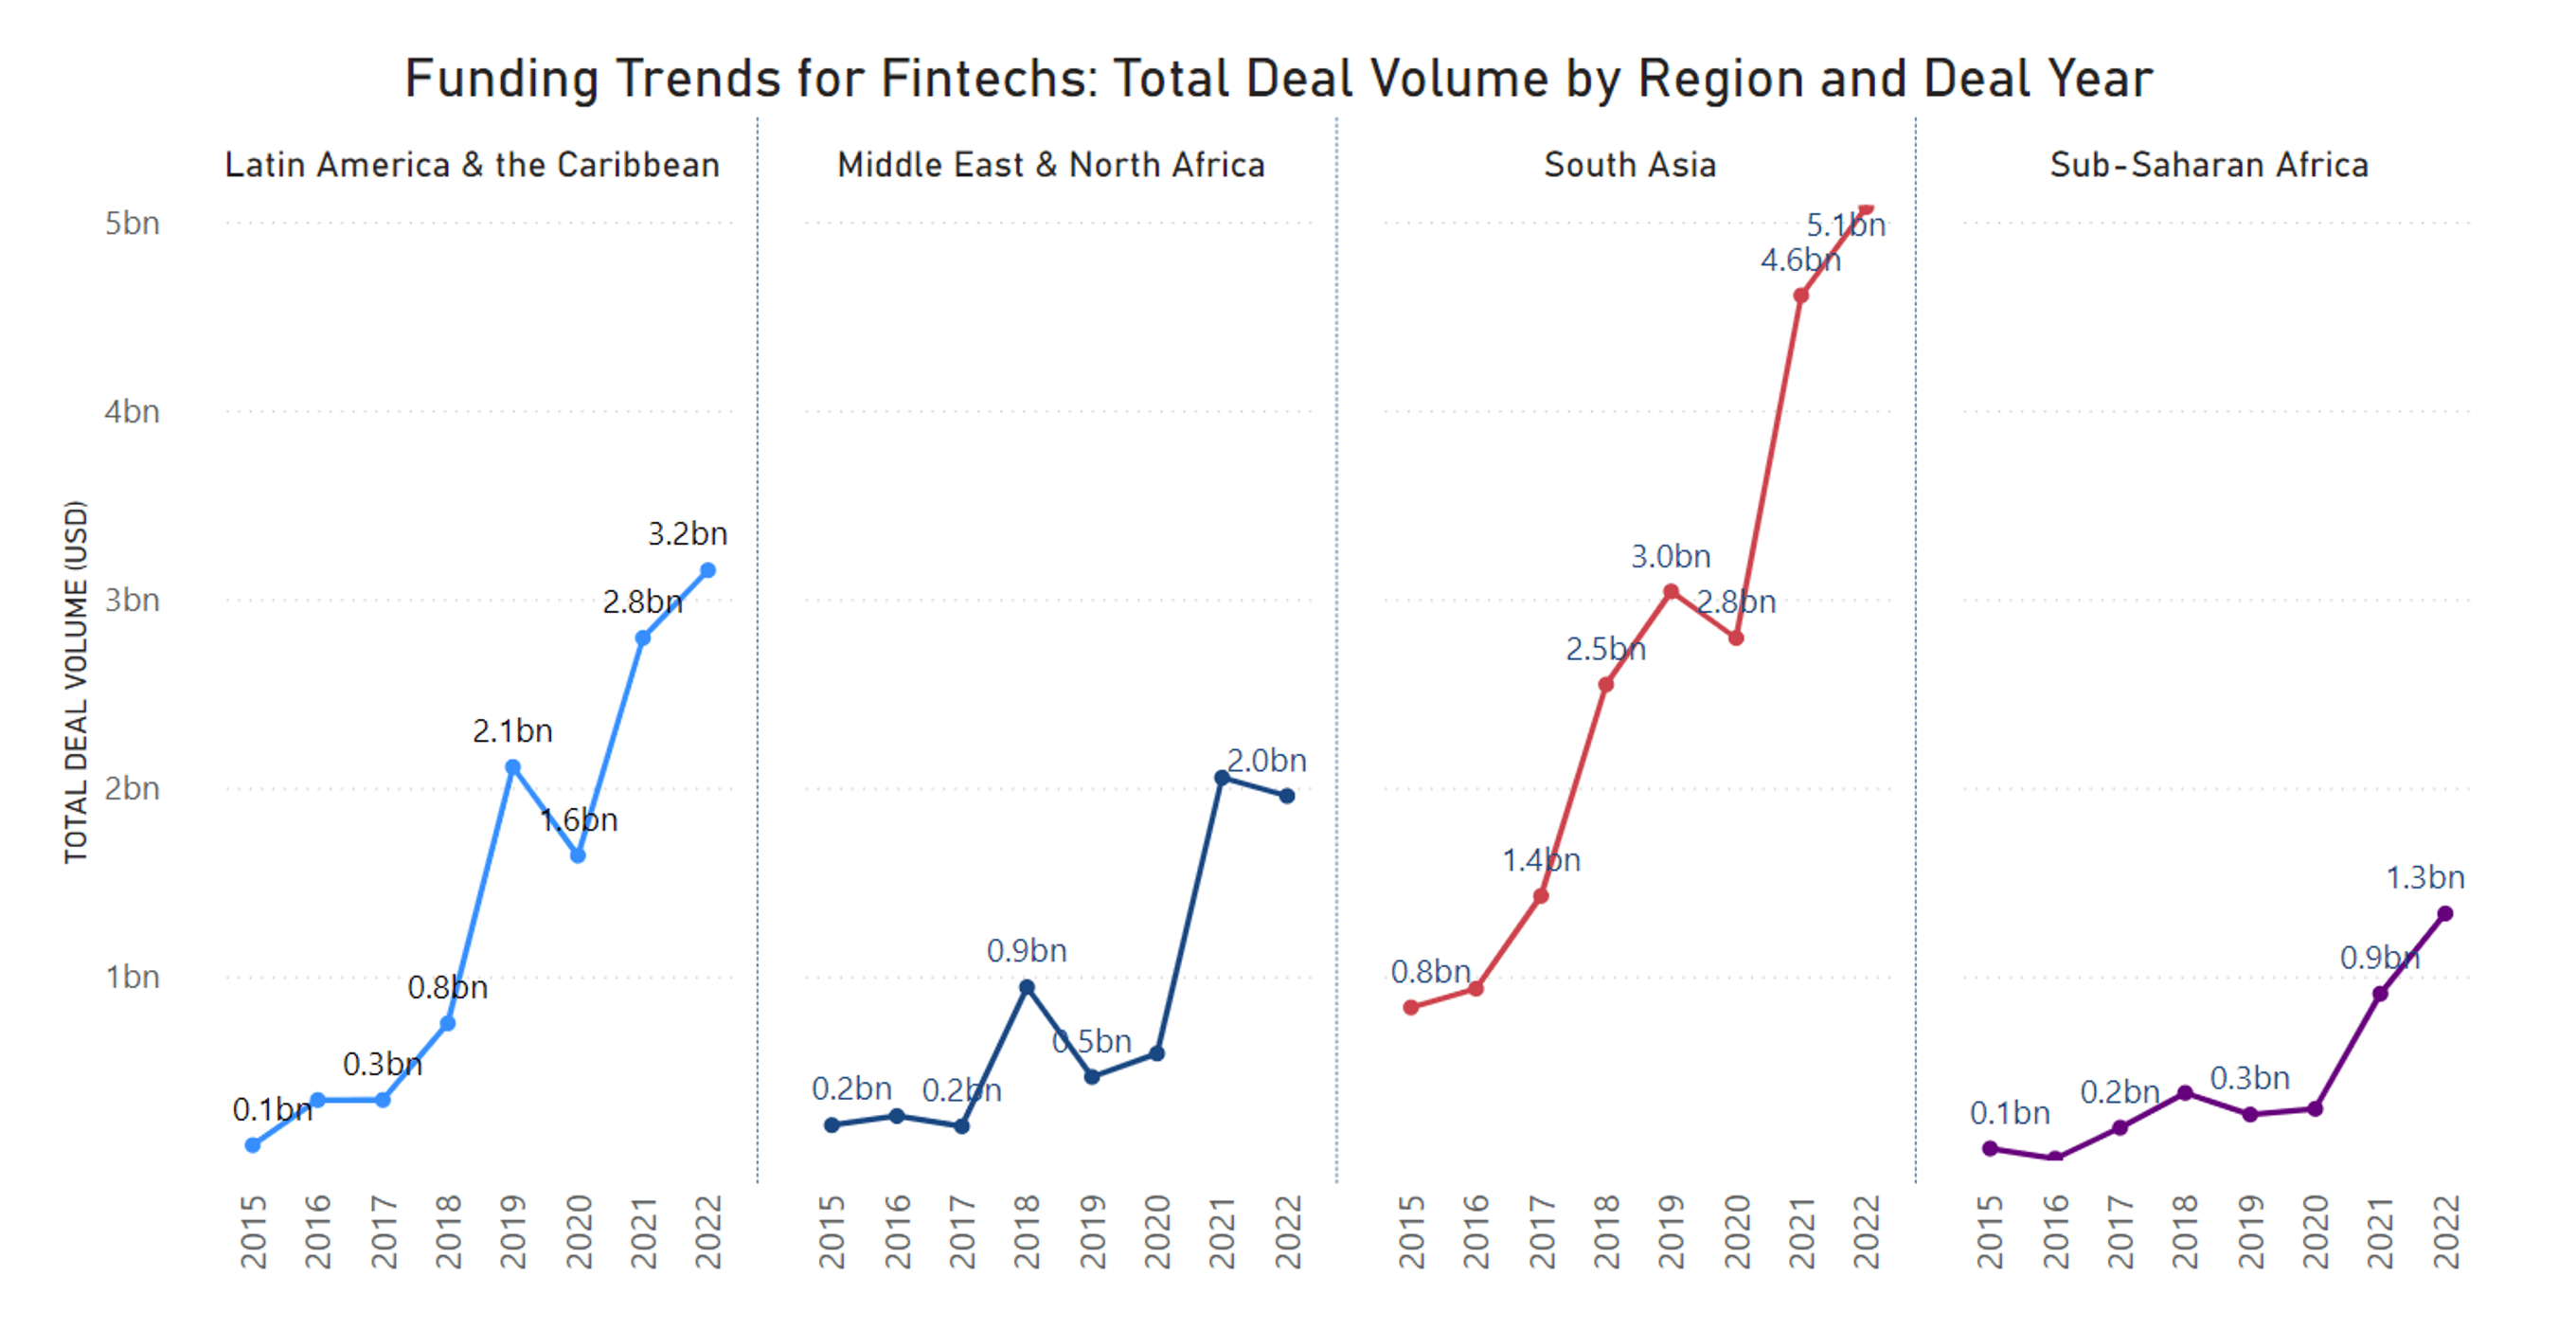
However, in 2022, the growth in both deal volume and the number of deals was more modest, with a 10 percent increase in deal volume and a 2 percent increase in the number of deals. The number of deals declined or remained stagnant in India, the Middle East & North Africa, and Latin America & the Caribbean, while it increased in Sub-Saharan Africa.
Then, in January and February 2023, the sector witnessed a significant 54 percent decrease in overall deal volume compared to the same period in 2022. Of the four regions, the Middle East & North Africa was the only region to see an increase in overall deal volume during this period, with all others declining.
By Q3 2022, industry stakeholders began experiencing a ‘fintech funding winter,’ a term that references the current state of declining funding opportunities and company valuations across the fintech sector. Since then, there has been a noticeable decrease in funding and deals within the global fintech ecosystem during Q2 2023, reaching the lowest level since 2017. In Africa, there was a significant 37 percent year-on-year decline in total transaction value for African start-ups between June 2022 and July 2023 compared to the same corresponding period in the prior year.
2. Funding remains geographically concentrated with a regional disparity in deal sizes.
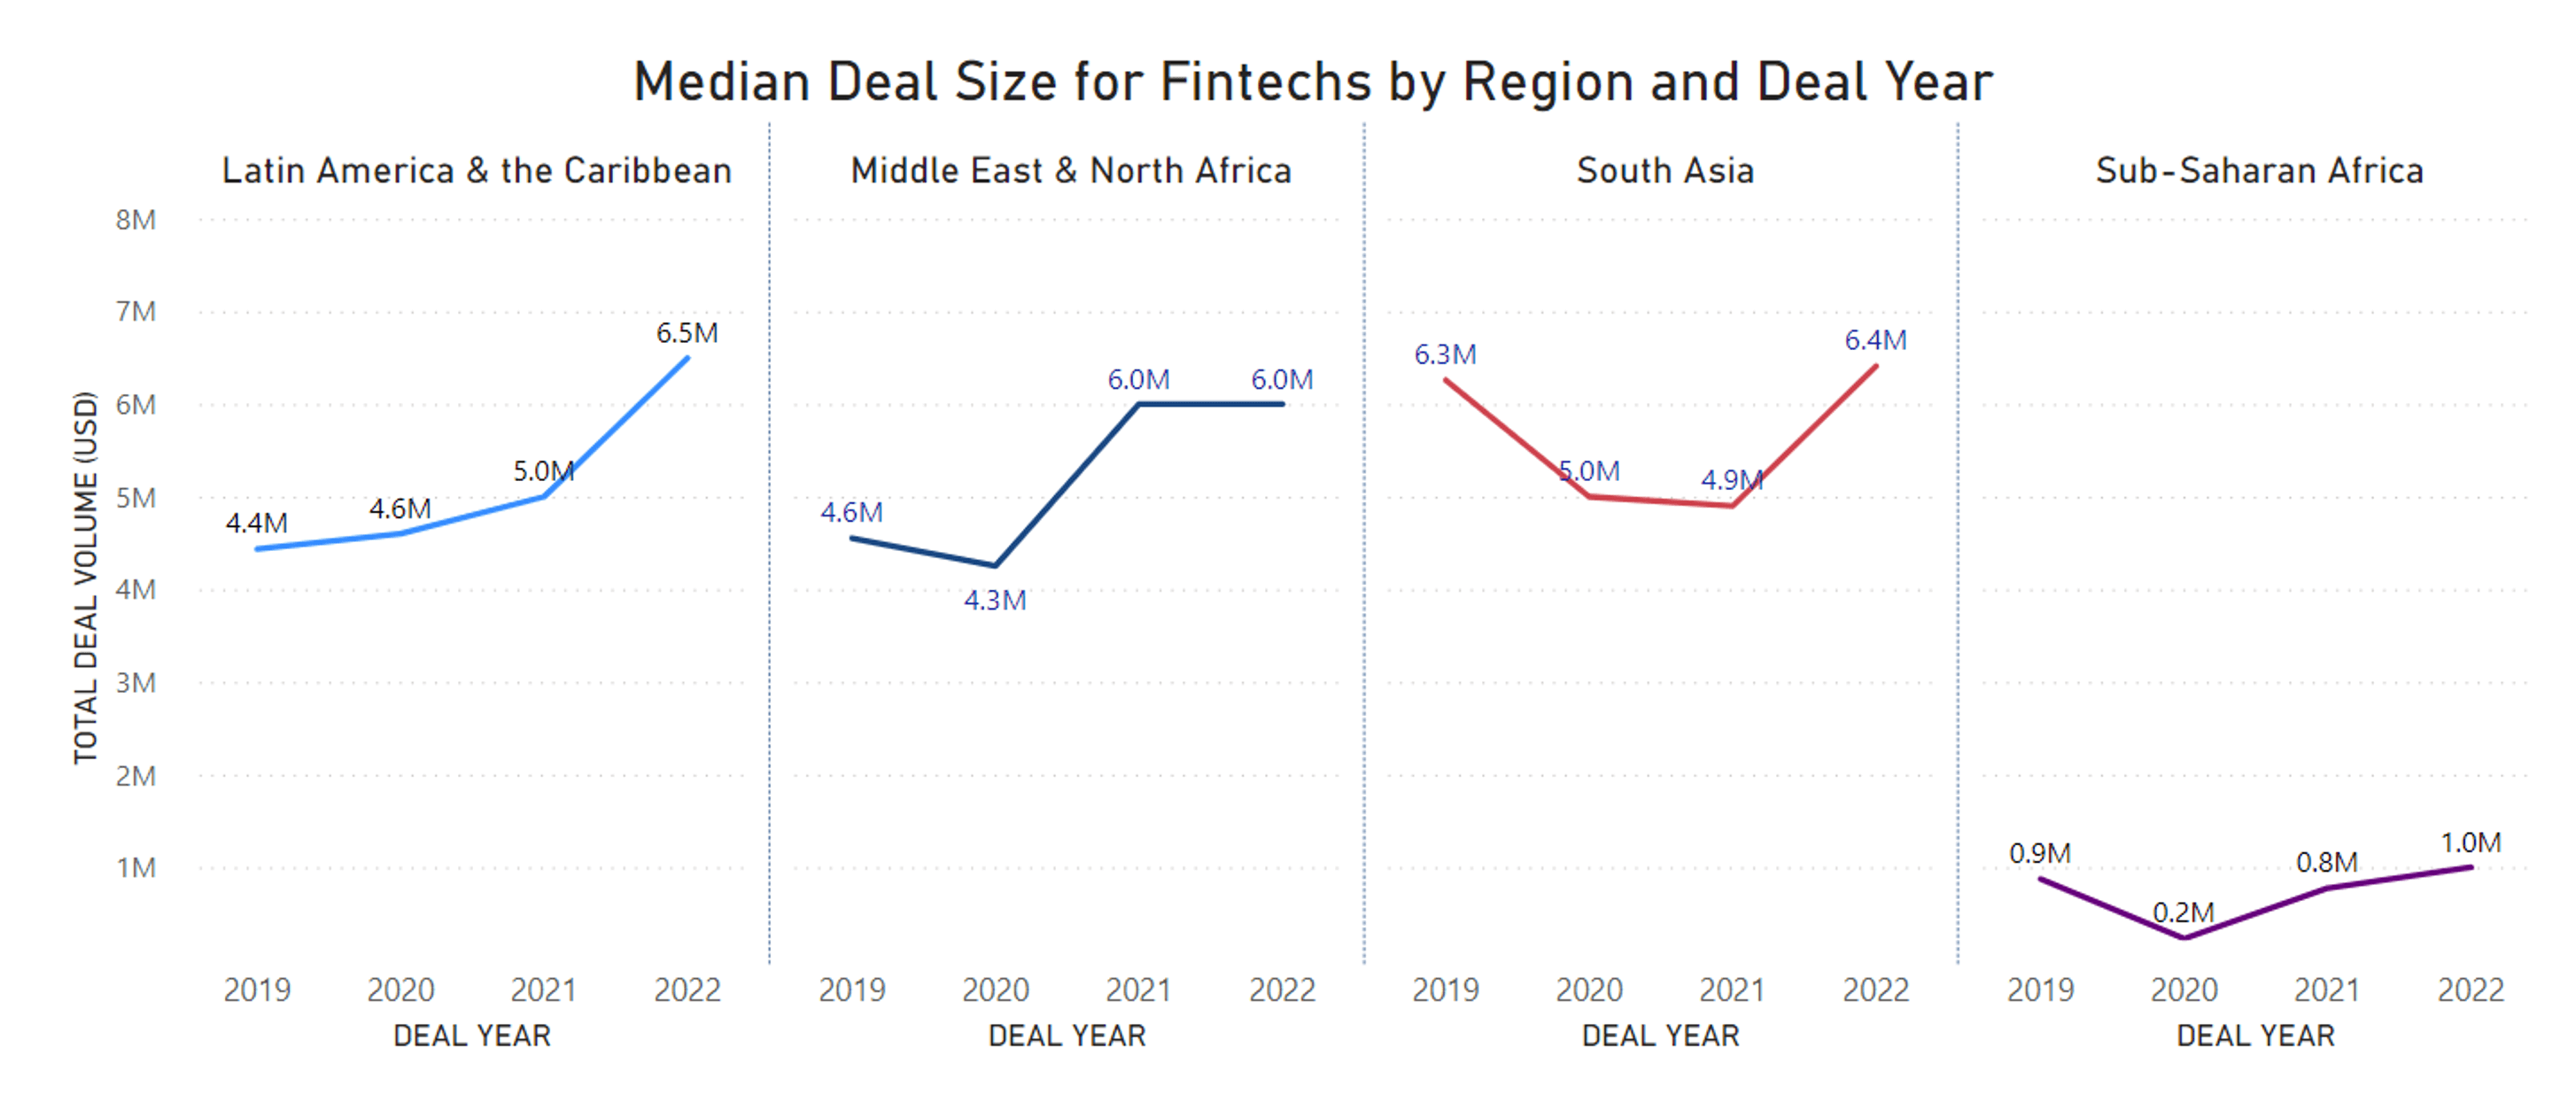
We also observed significant variation in the median deal sizes across different regions. In 2022, the median deal size in Sub-Saharan Africa was $1 million, reflecting the prevalence of very early-stage fintechs. In contrast, the median deal size in 2022 was $6.5 million for fintechs in Latin America & the Caribbean region and $6.4 million in South Asia. This difference illustrates how regions have distinct funding dynamics and growth trajectories.
Looking at trends over the past four years, we see that from 2020 to 2021, the median deal size remained unchanged in South Asia while increasing in the other three regions. From 2021 to 2022, the median deal size increased across all regions except the Middle East & North Africa, which stayed constant.
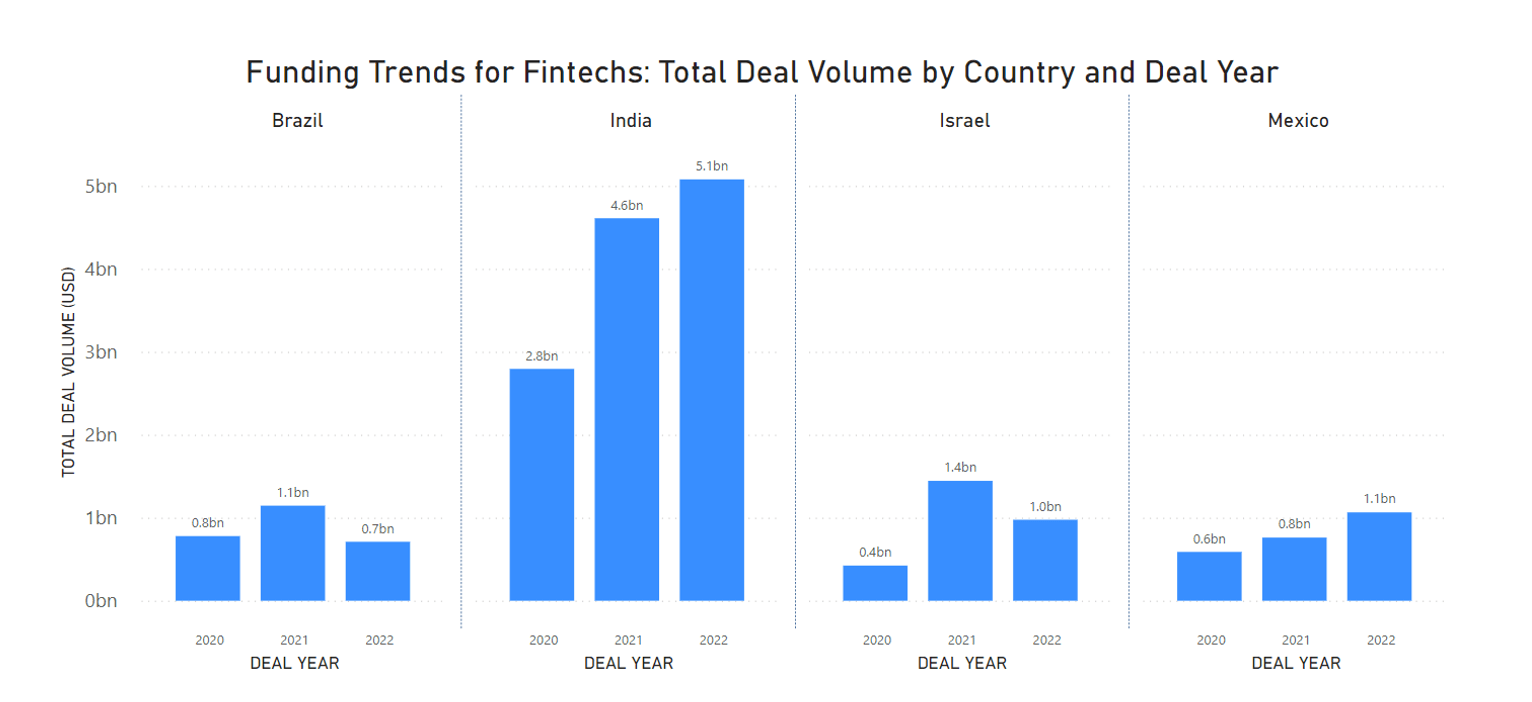
In the dynamic world of fintech funding, four countries – India, Brazil, Israel, and Mexico – received 80 percent of the overall funding in recent years. India leads with a total funding volume of $22 billion between 2015 and 2023, showcasing its thriving fintech ecosystem and investors’ support. Brazil and Israel both secured $4.5 billion in total funding volume, with Mexico attracting $3.7 billion. Funding to Brazil, Israel, and Mexico captured a considerable share of their region’s funding (40 percent, 65 percent, and 32, respectively).
Examining the period from 2020 to 2022, we see that the total deal volume increased in all four countries in 2021. However, in 2022, the total deal volume increased in India and Mexico but declined in Brazil and Israel.
Limited access to formal financial services, combined with rapid digitization in recent years and favorable regulatory frameworks, all contribute to these four countries attracting the majority of regional fintech funding.
Two factors have driven access to funding in these countries. First, consumer demand and unmet needs revealed significant market potential. Second, a conducive enabling environment in the form of regulations and policies encouraged innovation by financial service providers and adoption by consumers. Limited access to formal financial services, particularly credit for low-income individuals and MSMEs, combined with rapid digitization in recent years and favorable regulatory frameworks, all contribute to these four countries attracting the majority of regional fintech funding. For example, in India, initiatives like the Jan Dhan-Aadhaar-Mobile (JAM) trinity, the Unified Payments Interface (UPI), and updated regulations and policies accelerated digital adoption during the pandemic. Rapid digitization has benefited emerging fintech players, boosting digital financial solutions and driving financial inclusion.
While no African countries made it to the list of the top four countries with the largest funding in recent years, Nigeria stood out with the highest deal volume among African countries. It received a modest accounting for 40 percent of the region’s overall funding.
3. Regional variations in the demand for financial products influence funding distribution.
The distribution of funding by fintech product categories has shifted over time. Historically, credit products received the bulk of the funding within the fintech sector. Insurance, which typically receives lower levels of funding, surged in 2020 as the pandemic accelerated the demand for digital transformation. Insurance fintechs that were able to innovatively leverage digital and analytics became more attractive to investors. Additionally, we observed an increase in the share between 2018 and 2021, although this category declined in 2022. There is also an upward trend in the popularity of personal financial management products (PFM), as more fintechs and digital banks begin offering PFM products or PFM features.
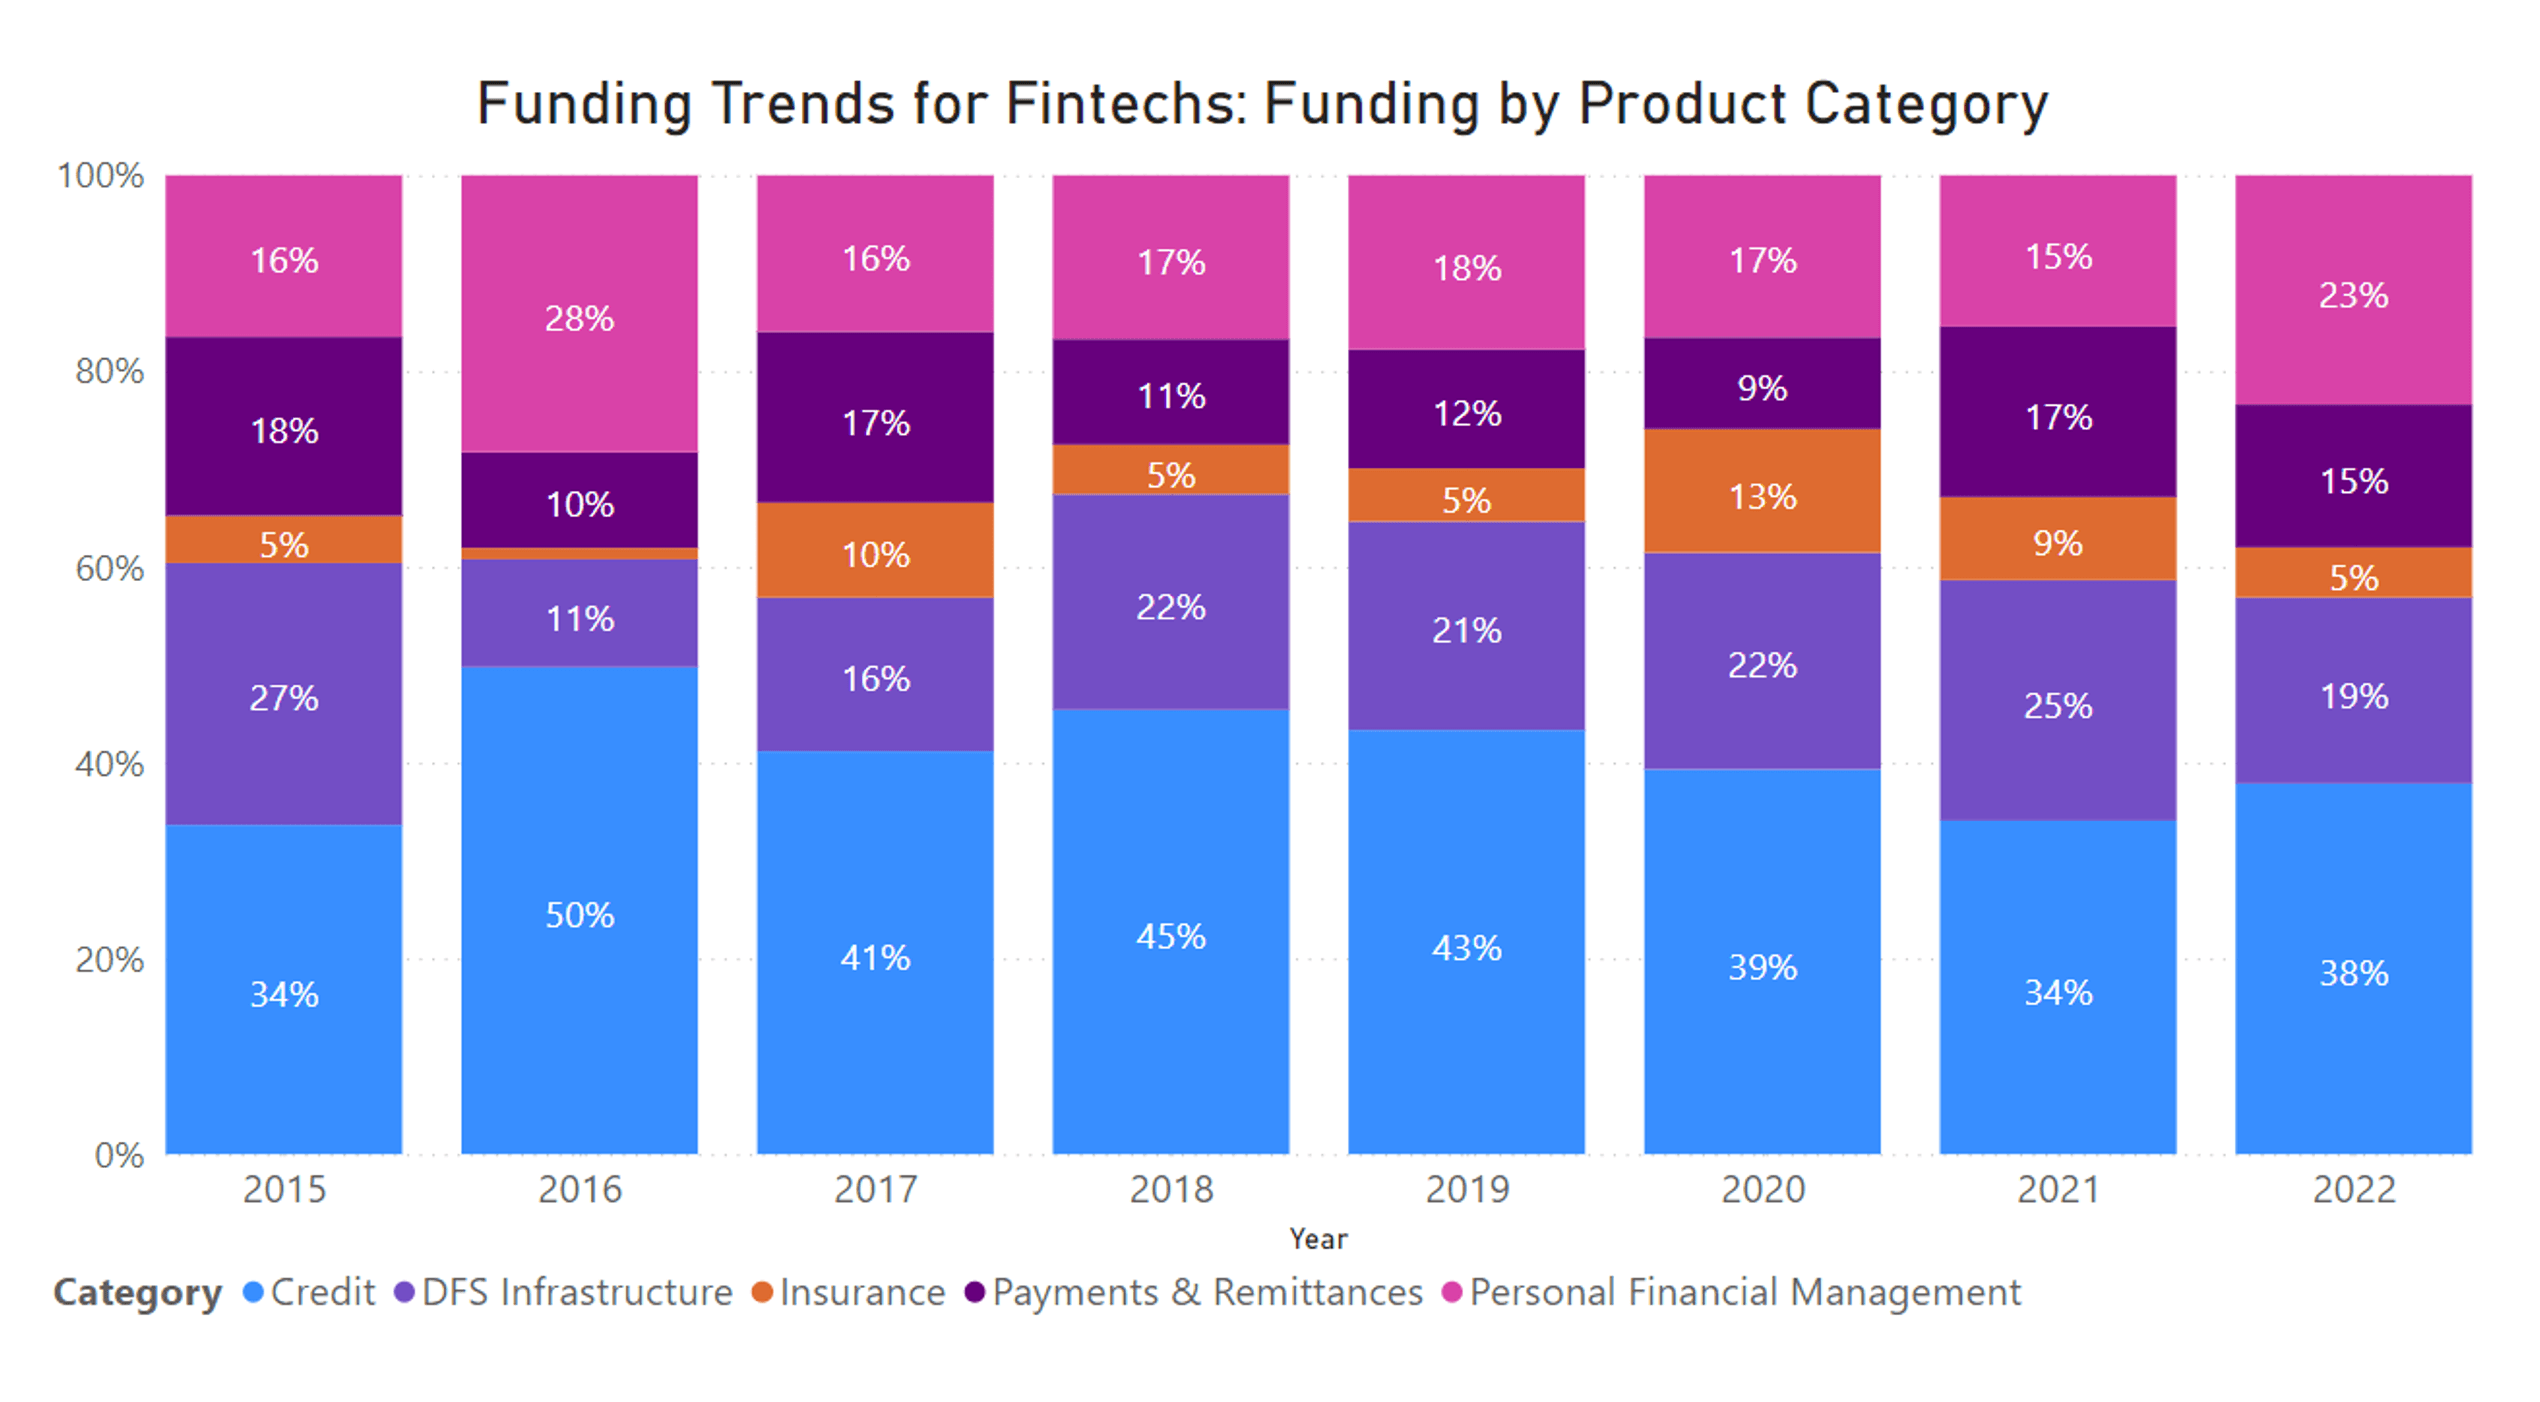
Looking at the breakdown of regional fintech funding by product category, we see the importance of catering to the unique financial demands of specific markets. For example, funding for credit fintechs dominates overall fintech funding in South Asia and Latin America & the Caribbean, while the Middle East & North Africa focuses on DFS infrastructure and PFM, and Sub-Saharan Africa prioritizes payments and remittances. Despite the ways in which insurance can enhance the resilience of low-income households, insurance products continue to receive minimal investor attention across all regions. Insurance products are typically offered as part of a product bundle and continue to be difficult to market and sell.
4. The funding gap for small deals could contribute to the ‘death valley curve’.
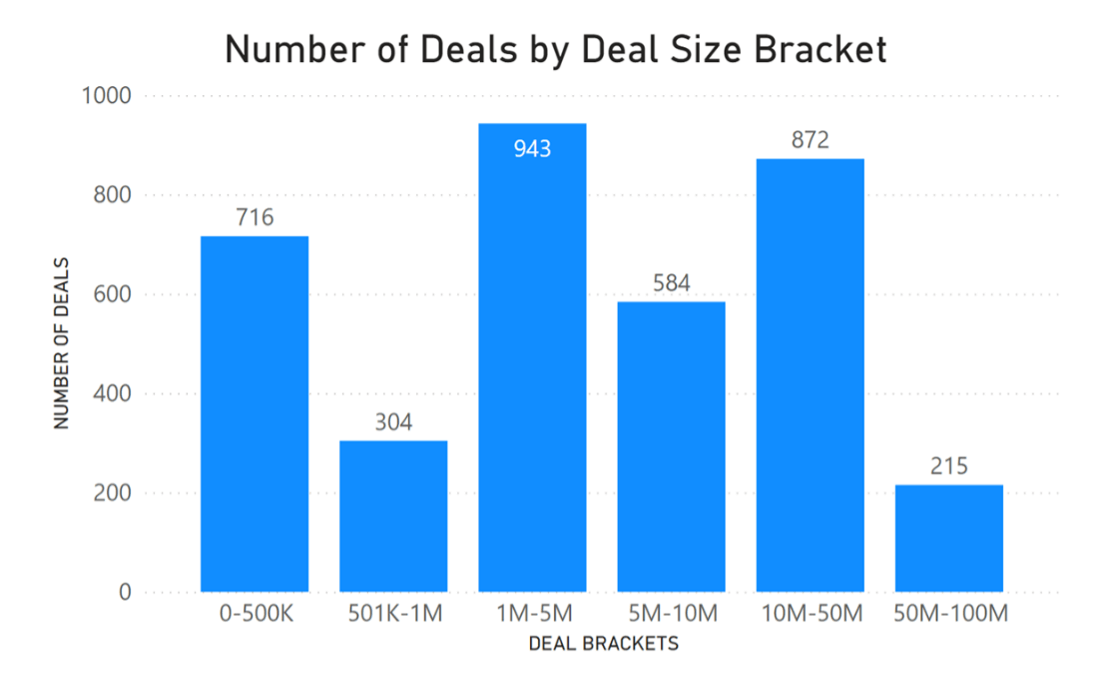
Looking at the past deals of the top 20 investors, we see a discrepancy among different types of funders’ investment strategies and risk appetites. Accelerators and incubators have a higher number of deals, but their median deal size remains relatively modest – often below $500,000. On the other hand, private equity, venture capital, and impact investing funds have median deal sizes ranging from $7 to $20 million, reflecting their substantial investment capacity.
We also see a dip in the number of deals targeted for early-stage fintechs – in the amount of $501,000 – $1 million – by any investor type. In 2020, despite an overall increase of more than 70 percent in the number of total deals that year, the proportion of deals within the $501,000 – $1 million range was only 8 percent. The proportion of deals conducted for this size bracket has remained consistently between 7 to 9 percent over the past 4 years, likely contributing to the ‘death valley curve’ experienced by start-ups.
Winter is Here
While global trends indicate that we are living in a fintech funding winter, not all hope is lost. The fintech sector continues to be an area of significant opportunity and innovation, attracting attention from investors globally. Recent funding trends highlight the dynamic nature of fintech investments, as fluctuations in deal volume, regional preferences, and investor interests impact the funding fintechs receive. In addition, because fintech funding responds to specific characteristics of national economies and factors that create an enabling environment – such as the speed of digitalization, level of innovation, regulatory frameworks, and funding gaps for low-income populations – it is useful to observe trends in the fintech industry to understand the market demand and needs for various financial solutions in different markets.
Fintech investors and other stakeholders should adopt a balanced perspective, draw upon the lessons learned from past successes and failures, and continue supporting inclusive fintechs that offer products to low-income households. By doing so, they can effectively guide inclusive fintechs toward sustained growth and impactful outcomes.
Authors


Explore More